About This Paper
When an SMB needs work done, three engagement models compete for the role: a domestic full-time employee, a freelancer (often offshore, sourced through Upwork, Fiverr, or Toptal), or a managed offshore staff member (placed through a partner like Hire Mountain). All three can do the same work for some role types. They have very different cost profiles, very different quality profiles, and very different operational implications.
This paper compares the three models head-to-head across the dimensions that actually determine outcomes: total cost, quality and consistency, retention, ramp time, management overhead, scalability, and risk. The conclusion is not that one model wins universally — each is the right answer for some role types and the wrong answer for others.
The conclusion is that the choice should be made deliberately, based on the role, rather than defaulted to one model out of habit or familiarity. SMBs that pick the wrong model for a given role overpay, under-deliver, or both.
Key Findings
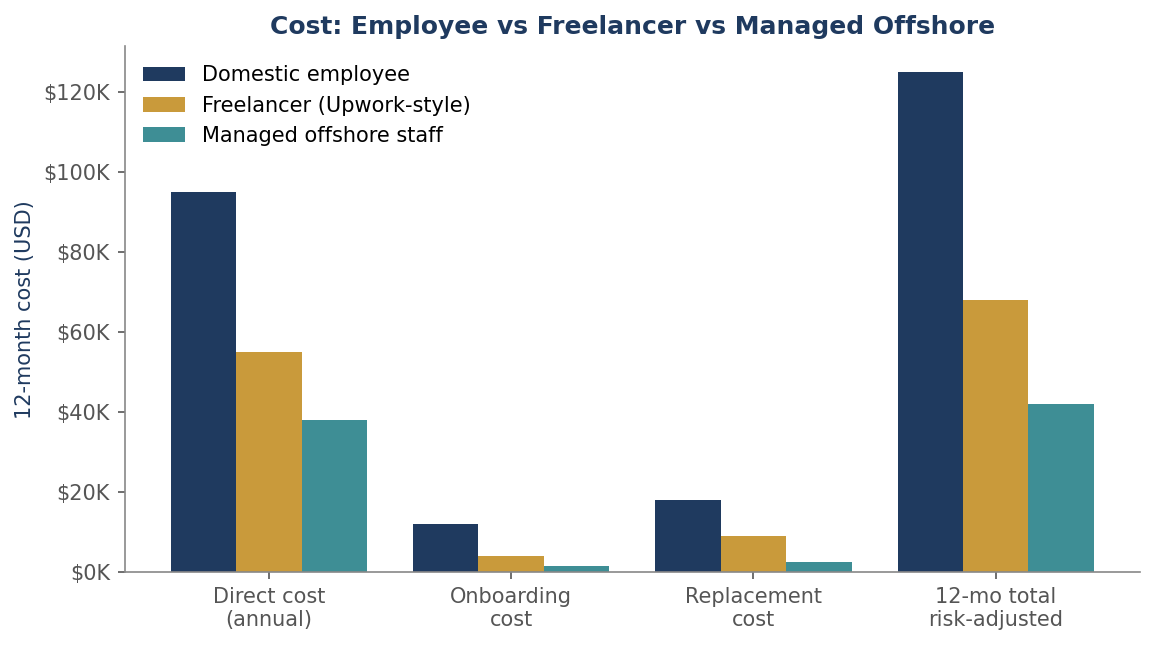
- Domestic full-time employees cost 2.5–3.5× managed offshore staff for equivalent role tiersBut win on timezone overlap, in-person collaboration, and embedded relationships with North American customers.
- Freelancers cost 30–50% more in total cost of ownership than managed offshore staff for ongoing rolesDespite lower hourly rates — driven by higher turnover, weaker behavioral matching, and the absence of bundled operational services.
- Quality and consistency outcomes favor managed offshore staff over freelancers across nearly every measurable dimensionRetention, ramp time, role-fit, and embedded process knowledge — comparable to domestic employees for the seven offshore-ready role types.
- The optimal SMB workforce is a mix of all threeDomestic employees for in-person, customer-facing, and strategic-leadership roles. Managed offshore for ongoing, documentable, output-verifiable roles. Freelancers for short, well-defined projects.
- Misallocation is the most common SMB workforce-design errorHiring a domestic employee for a documentable back-office role typically costs 60–70% more than necessary; using freelancers for ongoing roles produces turnover-driven instability.
What's Inside
- The Three Models DefinedDomestic full-time employee, freelance marketplace contractor, managed offshore staff.
- Total Cost (Fully Loaded)Cost ranking and the structural reasons behind it.
- Quality and ConsistencyMulti-dimensional quality comparison: technical correctness, on-time delivery, embedded knowledge, consistency.
- Retention as a Quality ProxyAverage tenure: domestic 3.0–4.5 years, managed offshore 2.6+ years, freelancers 4–9 months.
- Ramp Time, Management Overhead, ScalabilityHow each model compares on the operational dimensions.
- Cost Math: Three Representative RolesCustomer support, mid-level developer, senior accountant — full line-item breakdowns across all three models.
- The Decision FrameworkThree filters in sequence: must-be-domestic, ongoing-vs-project, offshore-readiness.
- Common Workforce-Design ErrorsDefaulting to domestic, defaulting to freelancers, treating cost as the only criterion.
Sources & Citations
- Robert Half. 2025 Salary Guide (North America Reference)
- U.S. Bureau of Labor Statistics. Employee Tenure Summary 2024
- SHRM. 2024 Cost of a Bad Hire Report
- Multiplier. Global Teams Report 2026 (n=5,000+)
- Deloitte. 2024 Global Outsourcing Survey
- Upwork & Fiverr Annual Reports 2024–2025
- Toptal published rate cards 2024–2025
- Hire Mountain. Internal Placement Data 2024–2026 (n=1,847)
Read the full white paper
17 pages of evidence-based analysis · April 2026 · Free, no email required
Download PDF →