About This Paper
Most published quotes for offshore staffing cite the wrong number. They cite the candidate's gross monthly compensation, which is typically 40–60% of the actual fully-loaded cost the SMB will pay. This paper unpacks the real total cost of an offshore hire, including every line item — base compensation, statutory contributions, recruitment, equipment, software, management overhead, replacement risk, and the operational costs that rarely appear in vendor quotes.
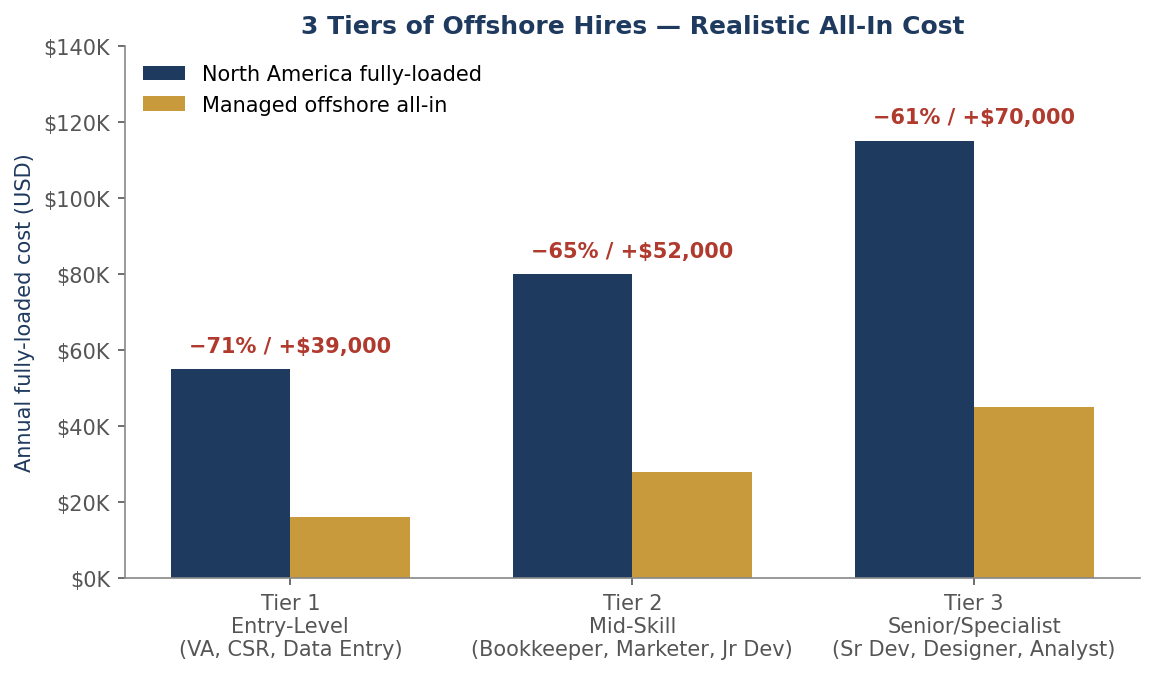
It then provides three honest tier-by-tier breakdowns (entry-level, mid-level, senior-level) showing the actual all-in numbers — and compares them against North American equivalents and DIY freelance marketplace alternatives.
The conclusion: offshore staffing through a managed-staffing model still produces 55–70% cost reduction versus equivalent North American hires when every cost line is included. The savings are real and durable. The transparency matters anyway — because SMBs that base their planning on the headline number alone find themselves over budget by 30–50% in year one.
Key Findings
- The headline rate is rarely the real rateA $1,500/month bookkeeper quote typically translates to $24,000–$32,000 in actual annual cost when statutory contributions, recruitment amortization, equipment, software, and management overhead are included.
- Hidden costs add 20–40% to the headline rate in self-managed offshore arrangementsAnd they are not optional — they are the cost of having the work actually get done.
- Managed-staffing partners bundle most of these costs into a flat rateNet total cost typically lands within 5–10% of well-budgeted self-managed cost, while removing the operational burden and compliance risk.
- DIY offshore via freelance marketplaces is cheaper per hour but more expensive in total cost of ownershipBy 30–50% once retention failures, project rework, and management time are properly counted.
- Entry tier: 65–75% savings vs NA. Mid tier: 60–65% savings. Senior tier: 50–60% savingsCost compression narrows as seniority rises (senior offshore talent is itself well-compensated locally) but never disappears.
What's Inside
- The Real Cost StackEvery line item: direct compensation, statutory contributions, recruitment, equipment, software, management overhead, replacement risk, operational coordination, performance/development.
- Tier 1: Entry-Level (1–3 years)Customer support, junior bookkeepers, virtual assistants. Full breakdown North America vs India vs Philippines.
- Tier 2: Mid-Level (3–7 years)Mid-developers, full-cycle accountants, marketing specialists. Full breakdown NA vs India vs Vietnam.
- Tier 3: Senior-Level (7+ years)Senior engineers, controllers, senior data engineers. Full breakdown NA vs India vs Vietnam.
- Managed-Staffing vs Self-Managed OffshoreWhen each model is the right choice — and why managed lands within 5–10% of well-budgeted self-managed.
- The Freelance Marketplace AlternativeWhy per-hour rates undercount true cost: turnover, ramp re-cost, quality variance, and the 30–50% TCO premium.
- Honest Comparison TableSide-by-side capabilities, costs, and risks across the three engagement models.
Sources & Citations
- Insignia Resources. Outsourcing Rates by Country: 2025 Pricing Benchmarks
- WiseMonk. Offshore Staffing: The Complete Global Buyer's Guide 2026
- AGSI. Offshore Staffing Philippines 2026: Real vs Hidden Costs
- Robert Half. 2025 Salary Guide (North America Reference)
- Deel & Remote. 2025 EOR Pricing and Compliance Benchmark
- Hire Mountain. Internal Placement Data 2024–2026 (n=1,847)
- SHRM. 2024 Cost of a Bad Hire Report
Read the full white paper
15 pages of evidence-based analysis · April 2026 · Free, no email required
Download PDF →